In my junior fall, I took the class “Visualizing Firearms History: An Applied Quantitative and Archival Approach.” As a humanities major, I had always wanted to learn data analysis, and while I was nervous to be trying something so far outside of my comfort zone, I figured the course would provide a good introduction to the field.
In the class, we learned the statistical programming language R and used it to analyze datasets related to firearms. As someone without prior data analysis experience, I found the class very difficult. Ultimately, though, I was able to succeed due to my own independent efforts.
Independent Learning
Each week, I attended tutoring sessions and prepared questions for the TAs, but I also spent hours outside of class conducting independent research. While working on our weekly assignments, I scoured Reddit, YouTube, and various coding forums for help performing specific functions, such as how to clean up data, produce summaries, and design appealing graphs. I would incorporate the pieces of sample code that I found into my own queries and experiment until I got the result I wanted.
Each week, I grew a little more comfortable with R. By the end of the semester, I was fluent in the basics of the language, and could even help my classmates when they ran into problems.
The Final Project
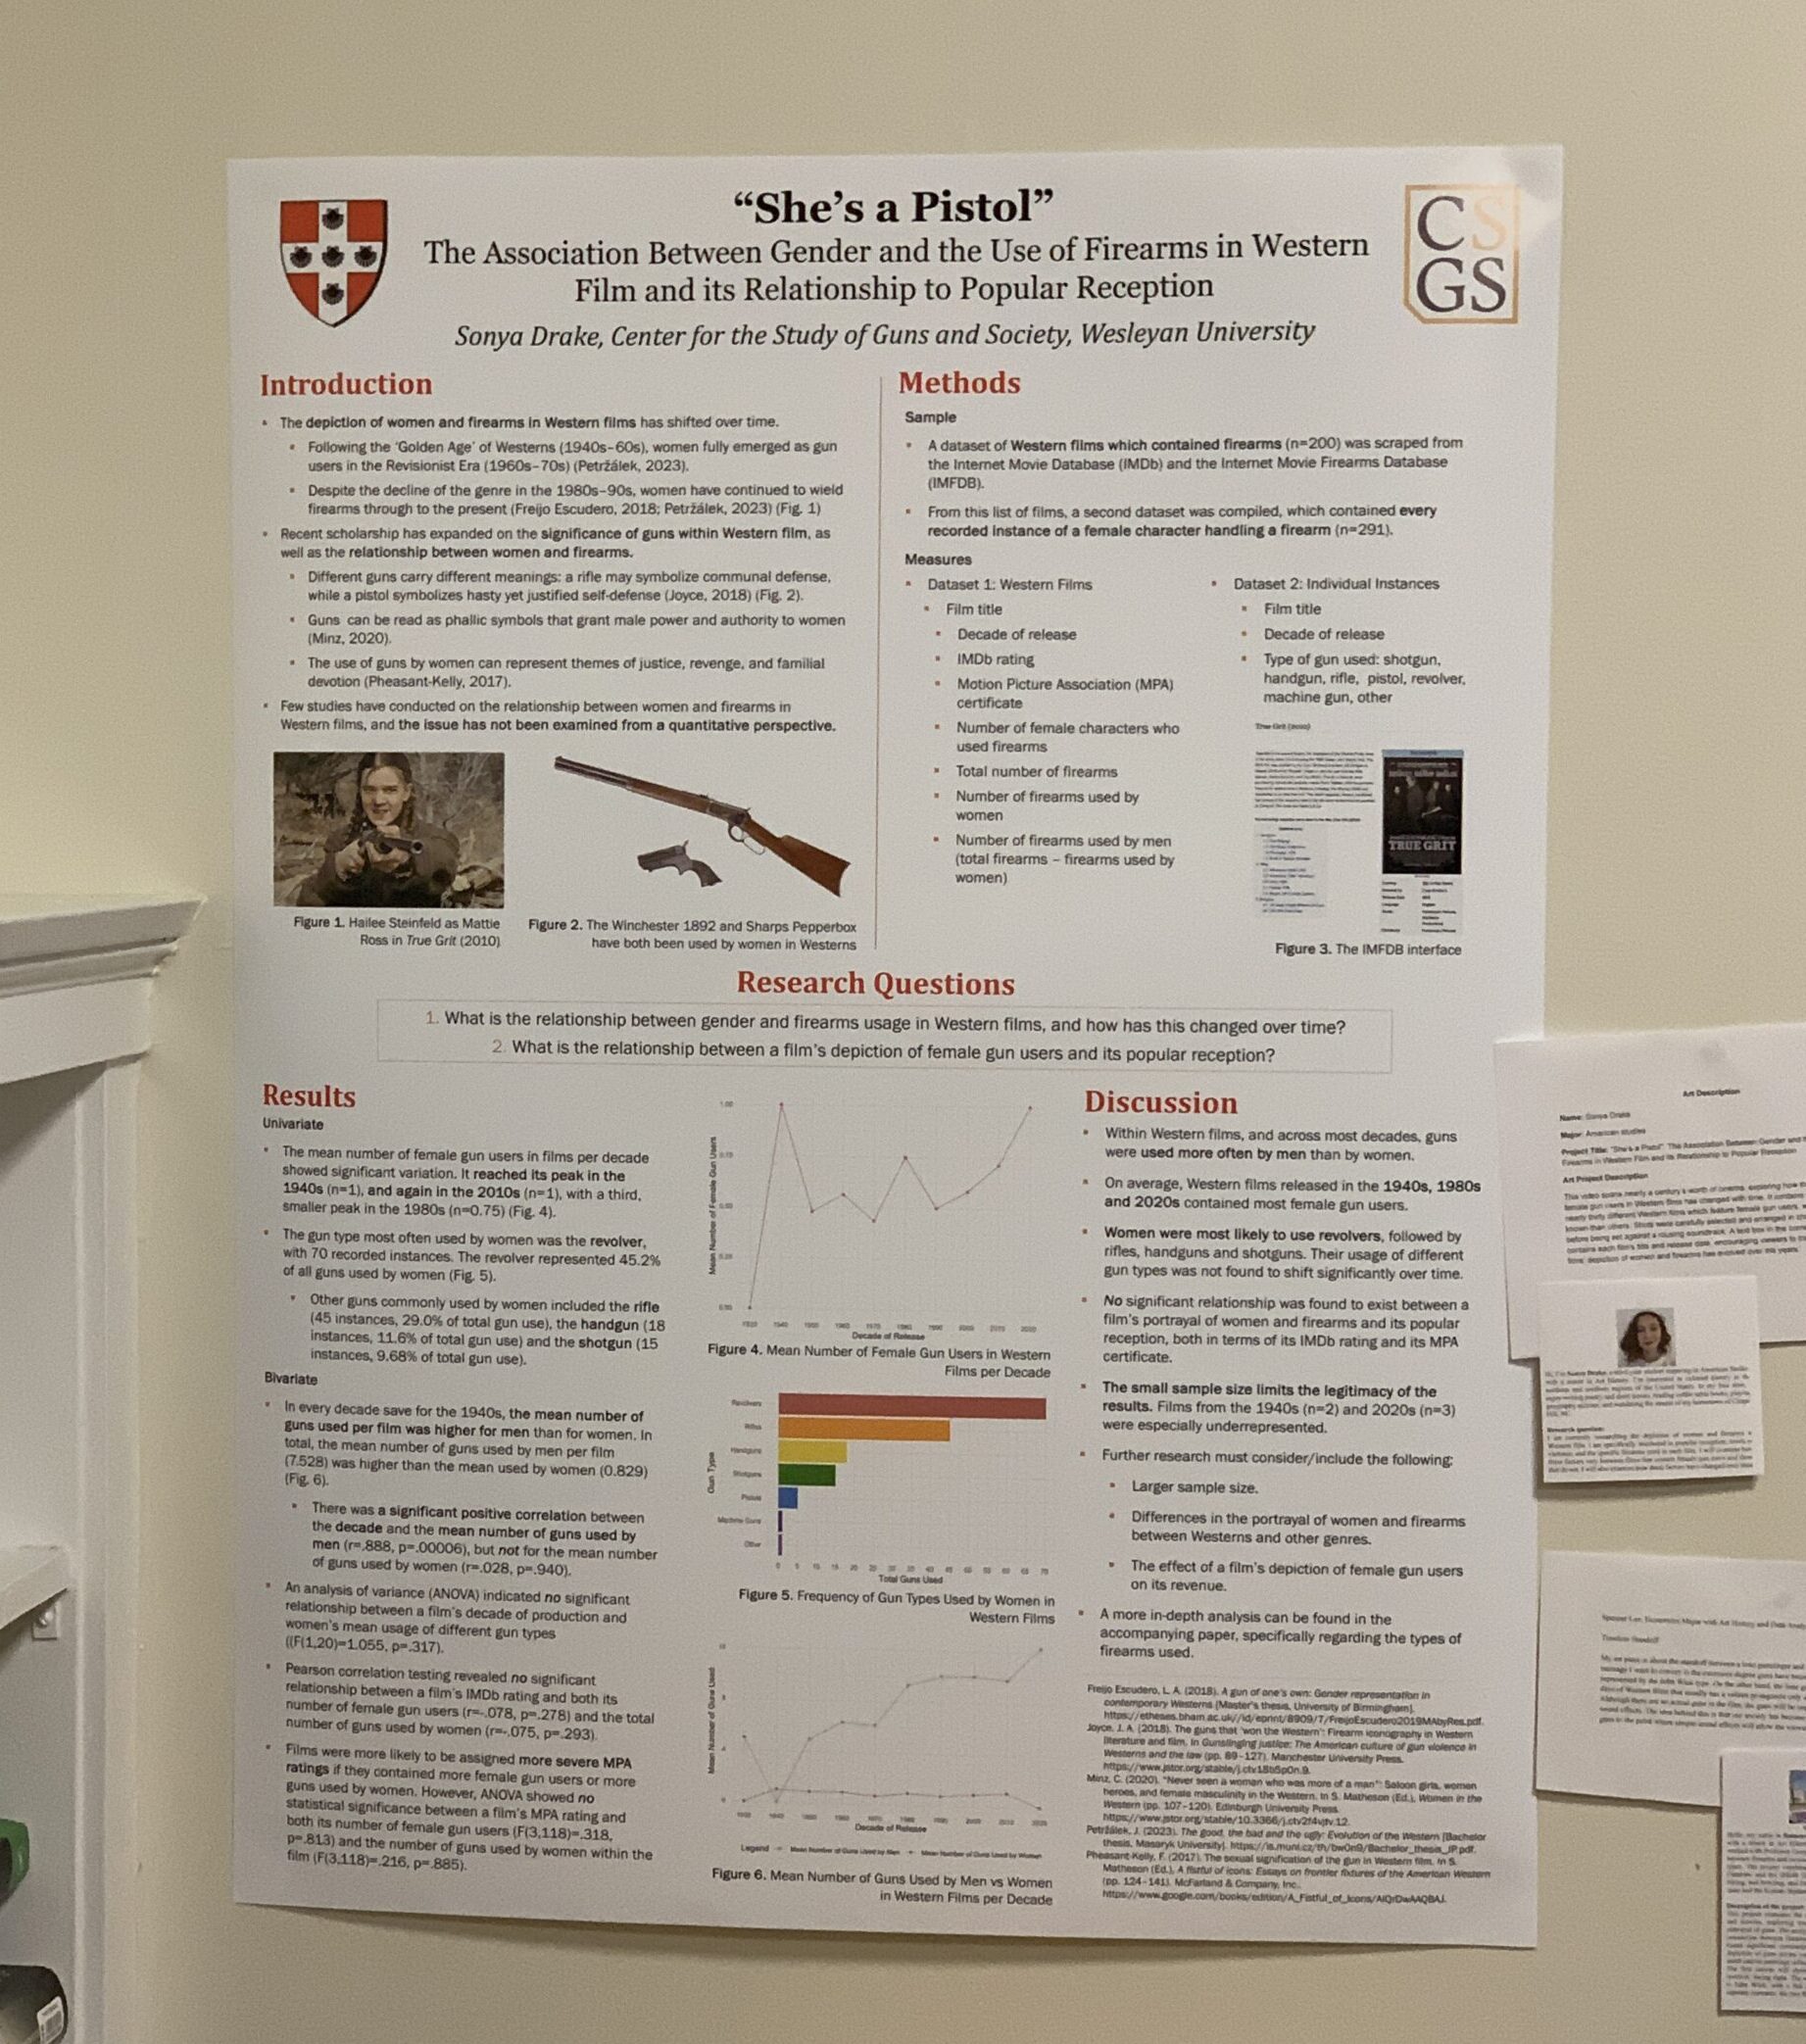
During the semester, each student researched their own firearms-related topic. I explored the relationship between women and firearms in Western films.
While making my research poster, I had to combine basic graphic design skills with my new R knowledge. After analyzing vast quantities of data scraped from both the IMDb and a more specialized firearms database, I used R to create graphs that displayed my findings in a visually striking manner.
The finished poster is one of the university assignments I’m most proud of, and it was featured at the Center for the Study of Guns and Society’s annual Undergraduate Research Conference the following spring.
